Presidential Debate Watson Tone Analysis
With the emotionally polarizing 2016 political landscape, I thought it would be cool to rationally analyze each candidate’s tone during each of the debates. Utilizing IBM Watson’s Tone Analyzer I set out to quantify the emotional range of each candidate.
View Results
First, in order to use the Tone Analyzer, I needed the transcribed speech text of each debate. So, I built a parser to extract the speech text from a given article url.
I arbitrarily chose The Washington Post as my data source for the speech transcripts and used BeautifulSoup to parse the html.
The bulk of the text extractor:
def _key_to_re(k):
    """A speaker is identified with
    {speaker_name}:
    """
    return r"{k}\: ".format(k=k)

soup = bs4.BeautifulSoup(article, "html.parser")

paragraphs = soup.find_all("p")

speaker = None
for p in paragraphs:
    found_name = None
    text = p.text
    for name in transcript:
        search = _key_to_re(name)
        found_name = re.match(search, text)
        if found_name:
            speaker = name
            text_with_speaker_removed = re.sub(search, "", text)
            transcript[name]["dialog"].append(text_with_speaker_removed)
            break
With the text for each speaker saved in a list, it was time to use Watson.
def run_analyzer(self, content):
    if type(content) == list:
        content_text = ". ".join(content)
    else:
        content_text = content
    response = self.analyzer.tone(content_text, sentences=False)
    if response:
        return response["document_tone"]
    return None
sentences = False to analyze the text as one document, not separate sentences
The response data returned by Watson needed some cleaning:
printer.pprint(transcript["TRUMP"])
{ 'tone_categories': [ { 'category_id': 'emotion_tone',
                         'category_name': 'Emotion Tone',
                         'tones': [ { 'score': 1.0,
                                      'tone_id': 'anger',
                                      'tone_name': 'Anger'},
                                    { 'score': 0.102859,
                                      'tone_id': 'disgust',
                                      'tone_name': 'Disgust'},
                                    { 'score': 1.0,
                                      'tone_id': 'fear',
                                      'tone_name': 'Fear'},
                                    { 'score': 0.081609,
                                      'tone_id': 'joy',
                                      'tone_name': 'Joy'},
                                    { 'score': 0.106559,
                                      'tone_id': 'sadness',
                                      'tone_name': 'Sadness'}]},
                                      ....
Next, I opened up an ipython notebook to clean the data in order to graph it.
from bokeh.charts import (
    Bar,
    show,
    output_file,
    output_notebook,
    )
from bokeh import plotting
import pandas as pd
import simplejson as json

C = "CLINTON"
T = "TRUMP"

tones = json.load(open("the-first-trump-clinton-presidential-debate-transcript-annotated.json", "r"))
tones_2 = json.load(open("everything-that-was-said-at-the-second-donald-trump-vs-hillary-clinton-debate-highlighted.json","r"))
tones_3 = json.load(open("the-final-trump-clinton-debate-transcript-annotated.json","r"))
def tones_to_df(json):
    """tranforms the response dict to DataFrame"""

    emotional_tones = []
    for k in json:
        if k in ("CLINTON", "TRUMP"):
            want = json[k]["tone_categories"]
            for w in want:
                list_of_d = w["tones"]
                for d in list_of_d:
                    d["candidate"] = k
                    emotional_tones.append(d)
    df = pd.DataFrame(emotional_tones)
    df = df[["candidate", "score", "tone_name"]]
    return df
# load dataframes in list
df_tones = []
for t in (tones, tones_2, tones_3):
    df_tones.append(tones_to_df(t))
def show_tone(df, name, tone):
    """
    helper function to view specific tone
    from a given debate
    """
    return df[ (df["tone_name"] == tone) & (df["candidate"] == name)]
# let's make sure the DataFrame is formatted correctly
show_tone(df_tones[0], C, "Tentative")
show_tone(df_tones[0], T, "Tentative")
| candidate | score | tone_name | |
|---|---|---|---|
| 7 | CLINTON | 0.274 | Tentative |
| 20 | TRUMP | 0.112 | Tentative |
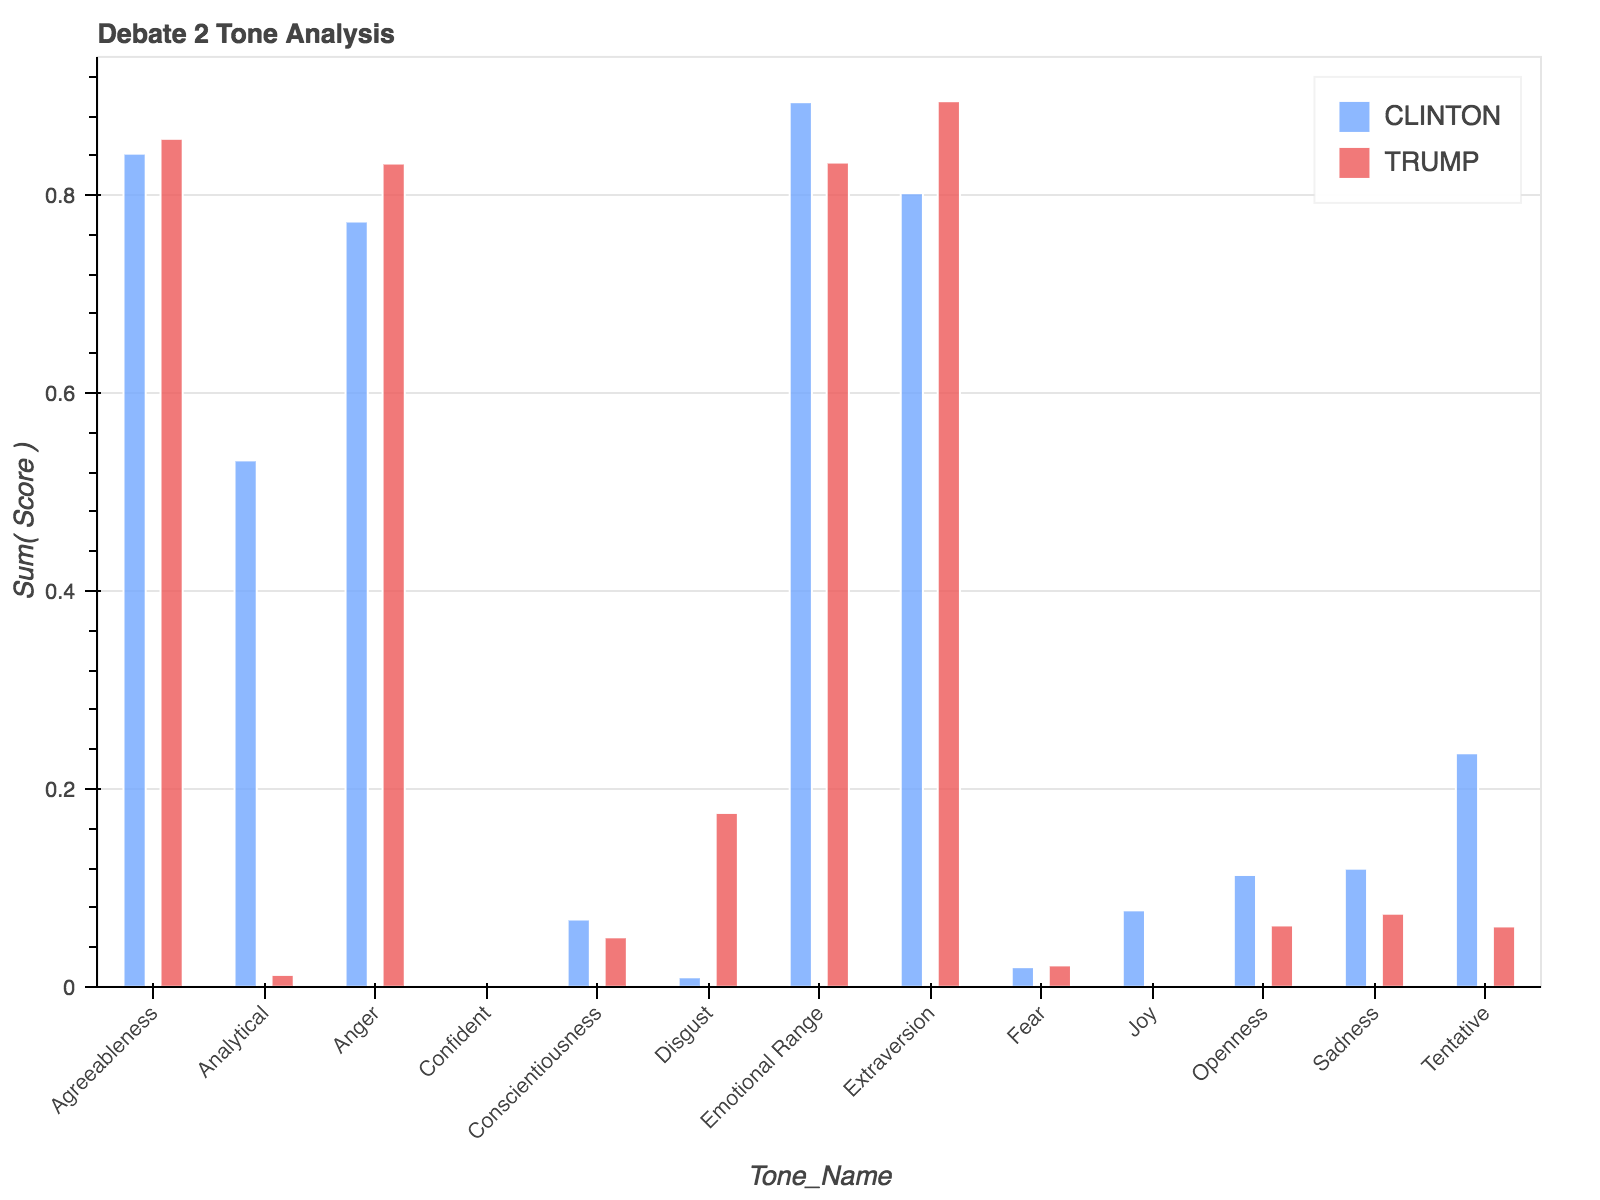
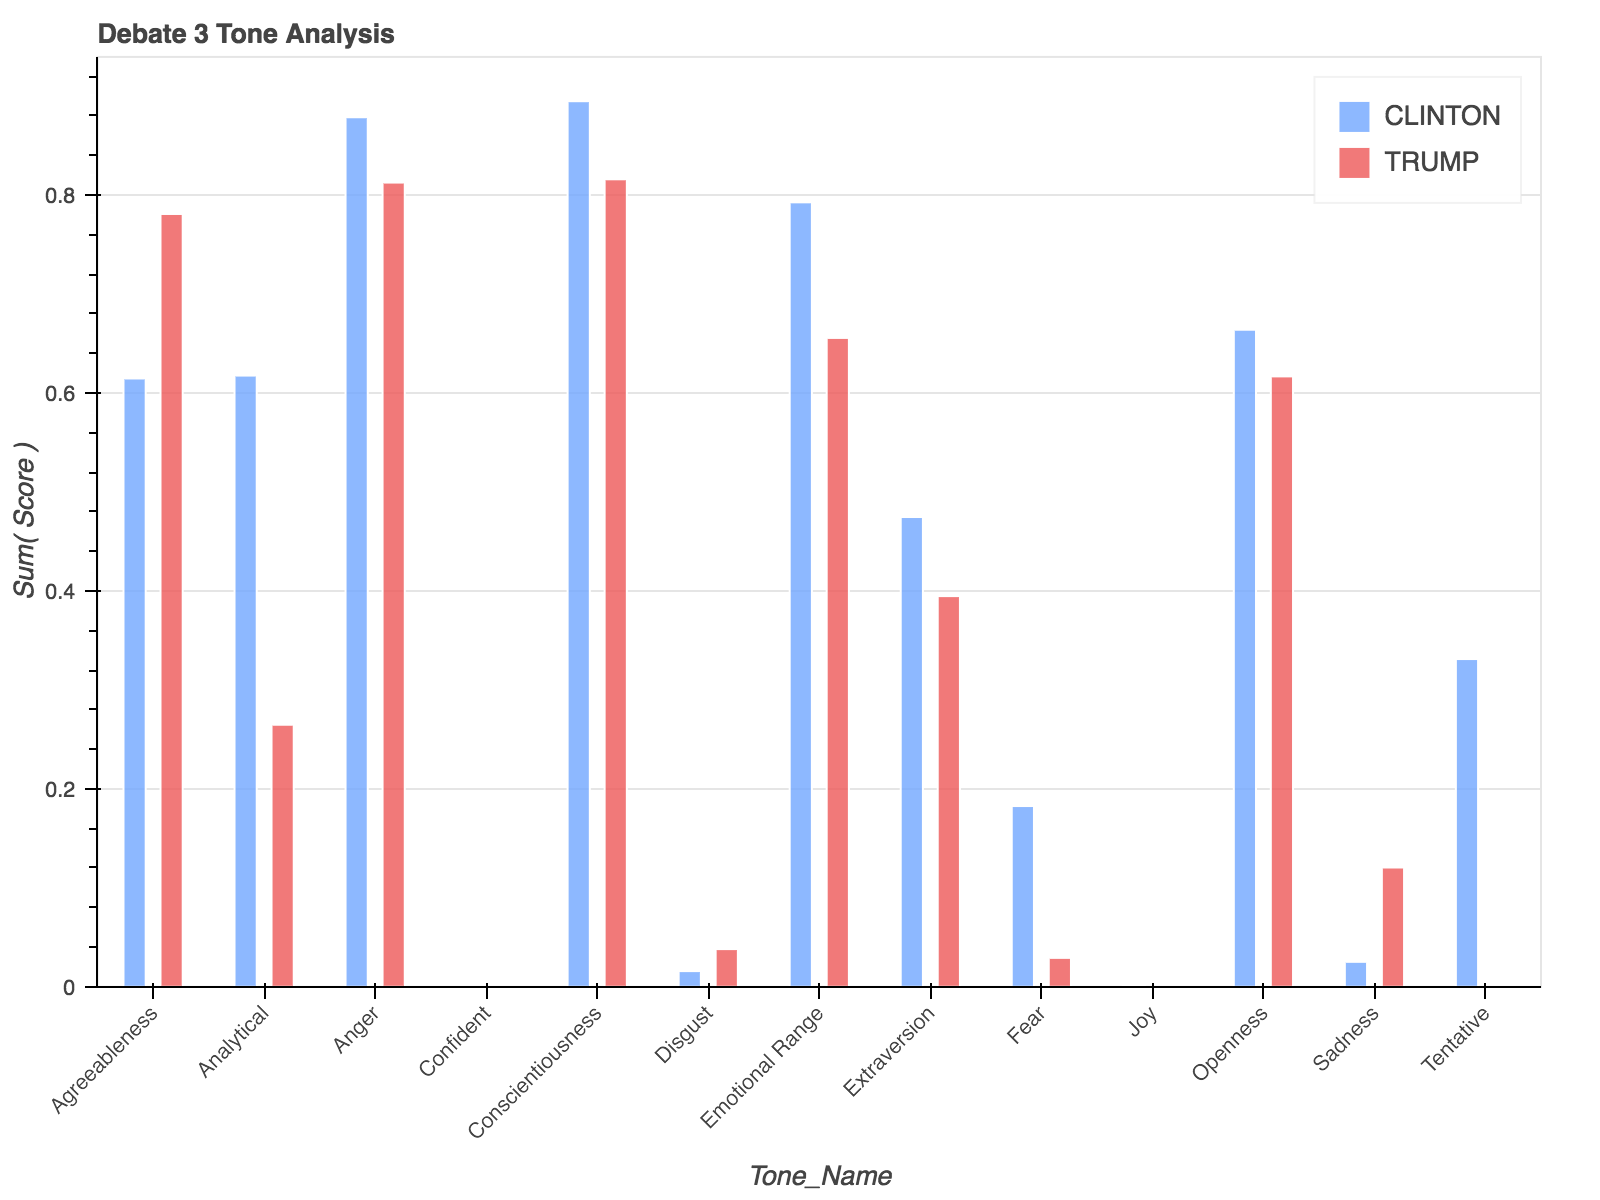
To plot the DataFrame for each debate, I used the Bokeh library, which creates quick clean charts.
def create_grouped_bar_from_df(df, num):
    b = Bar(df, "tone_name", values='score',
            group="candidate",
            title="2016 Presidential Debate Tone Analysis as per IBM Watson - Debate %s" % num,
            plot_height = 600,
            plot_width = 800,
            legend="top_right",
            color = ["#70a6ff", "#ed5757"])
    show(b)
for i, df in enumerate(df_tones):
    create_grouped_bar_from_df(df, i+1)
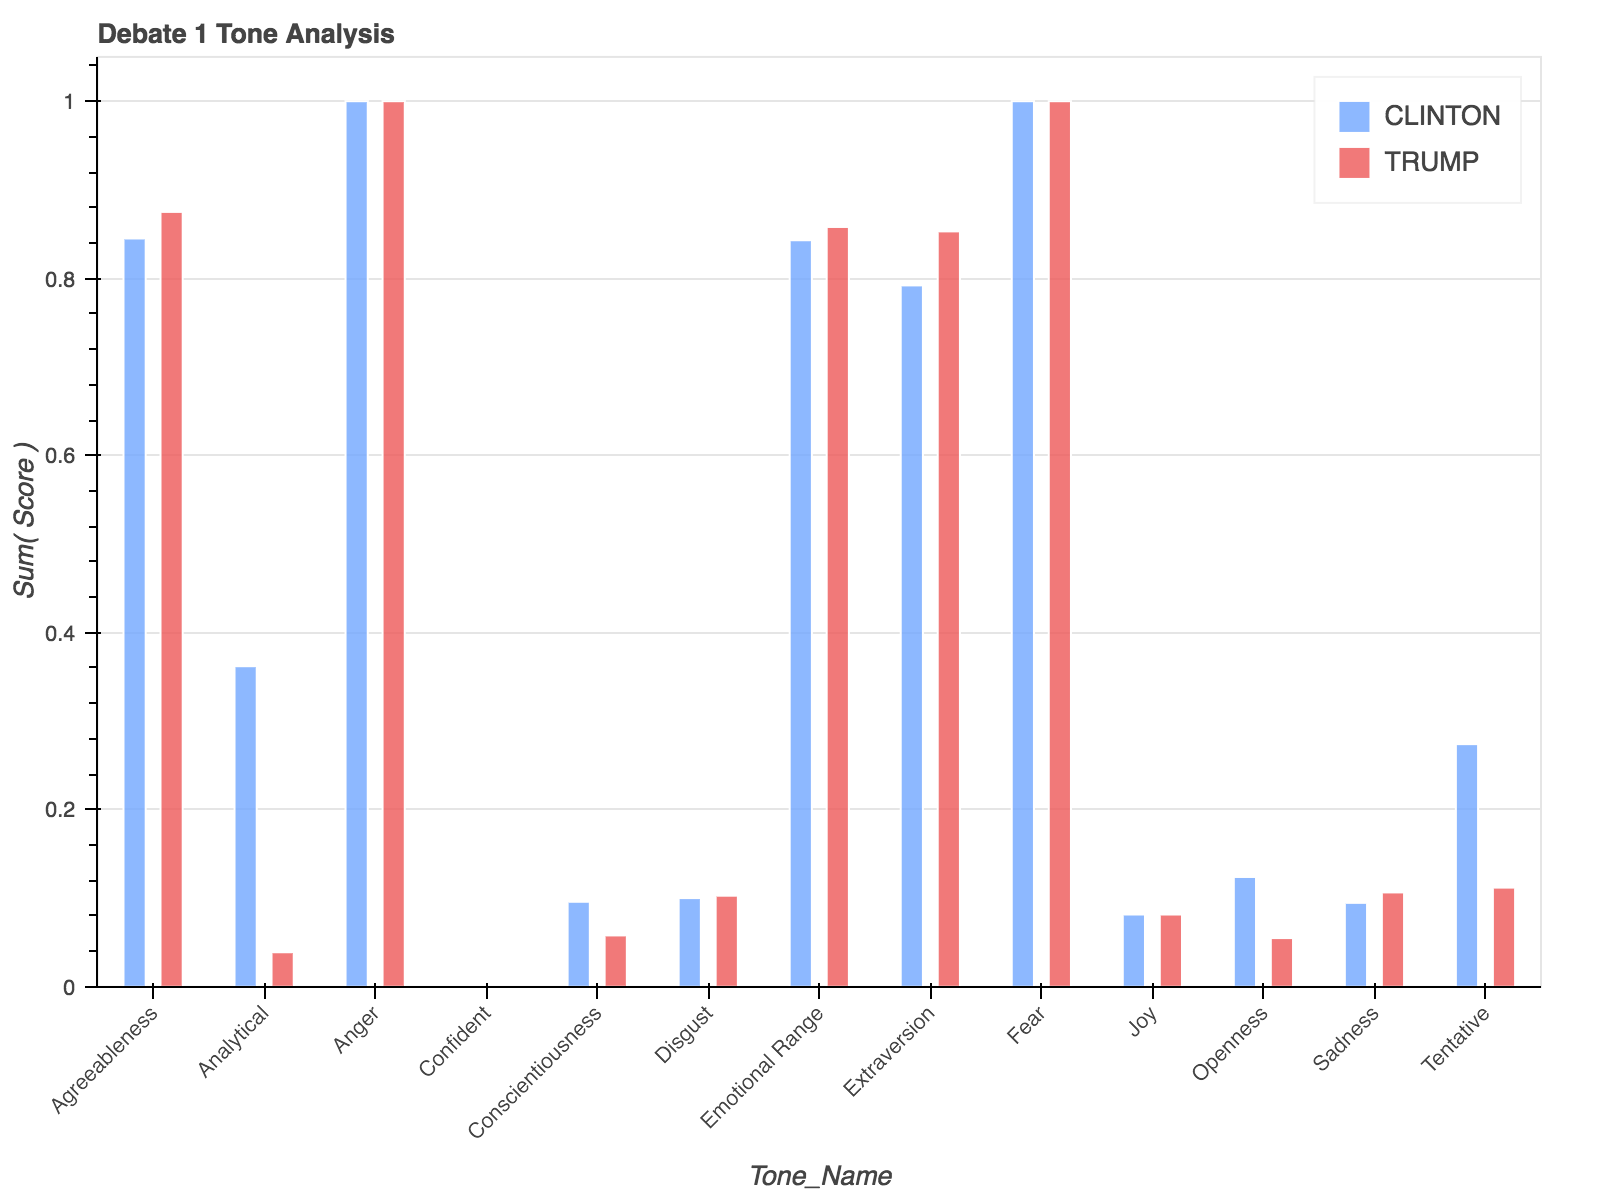
such anger, such fear
Finally, I merged the 3 debate DataFrames together to perform an aggregate analysis of each candidate’s overall tone.
# All transcripts combined in on df
df_all = pd.concat(df_tones)
# Get mean and median
df_all_mean = pd.DataFrame(df_all.groupby(["candidate", "tone_name"])["score"].mean()).reset_index()
df_all_median = pd.DataFrame(df_all.groupby(["candidate", "tone_name"])["score"].median()).reset_index()

# Add the aggregate statistic name to each df
df_all_mean["aggregate"] = "mean"
df_all_median["aggregate"] = "median"
df_aggregate = pd.concat([df_all_mean, df_all_median])
b = Bar(df_aggregate,
        "tone_name",
        values="score",
        group=["aggregate", "candidate"],
        title="Aggregate Debate Tone Analysis",
        plot_height = 600,
        plot_width = 800,
        legend="top_right",
        ylabel="Score",
        color = ["#70a6ff", "#ed5757", "#025df4", "#f20404"])
show(b)
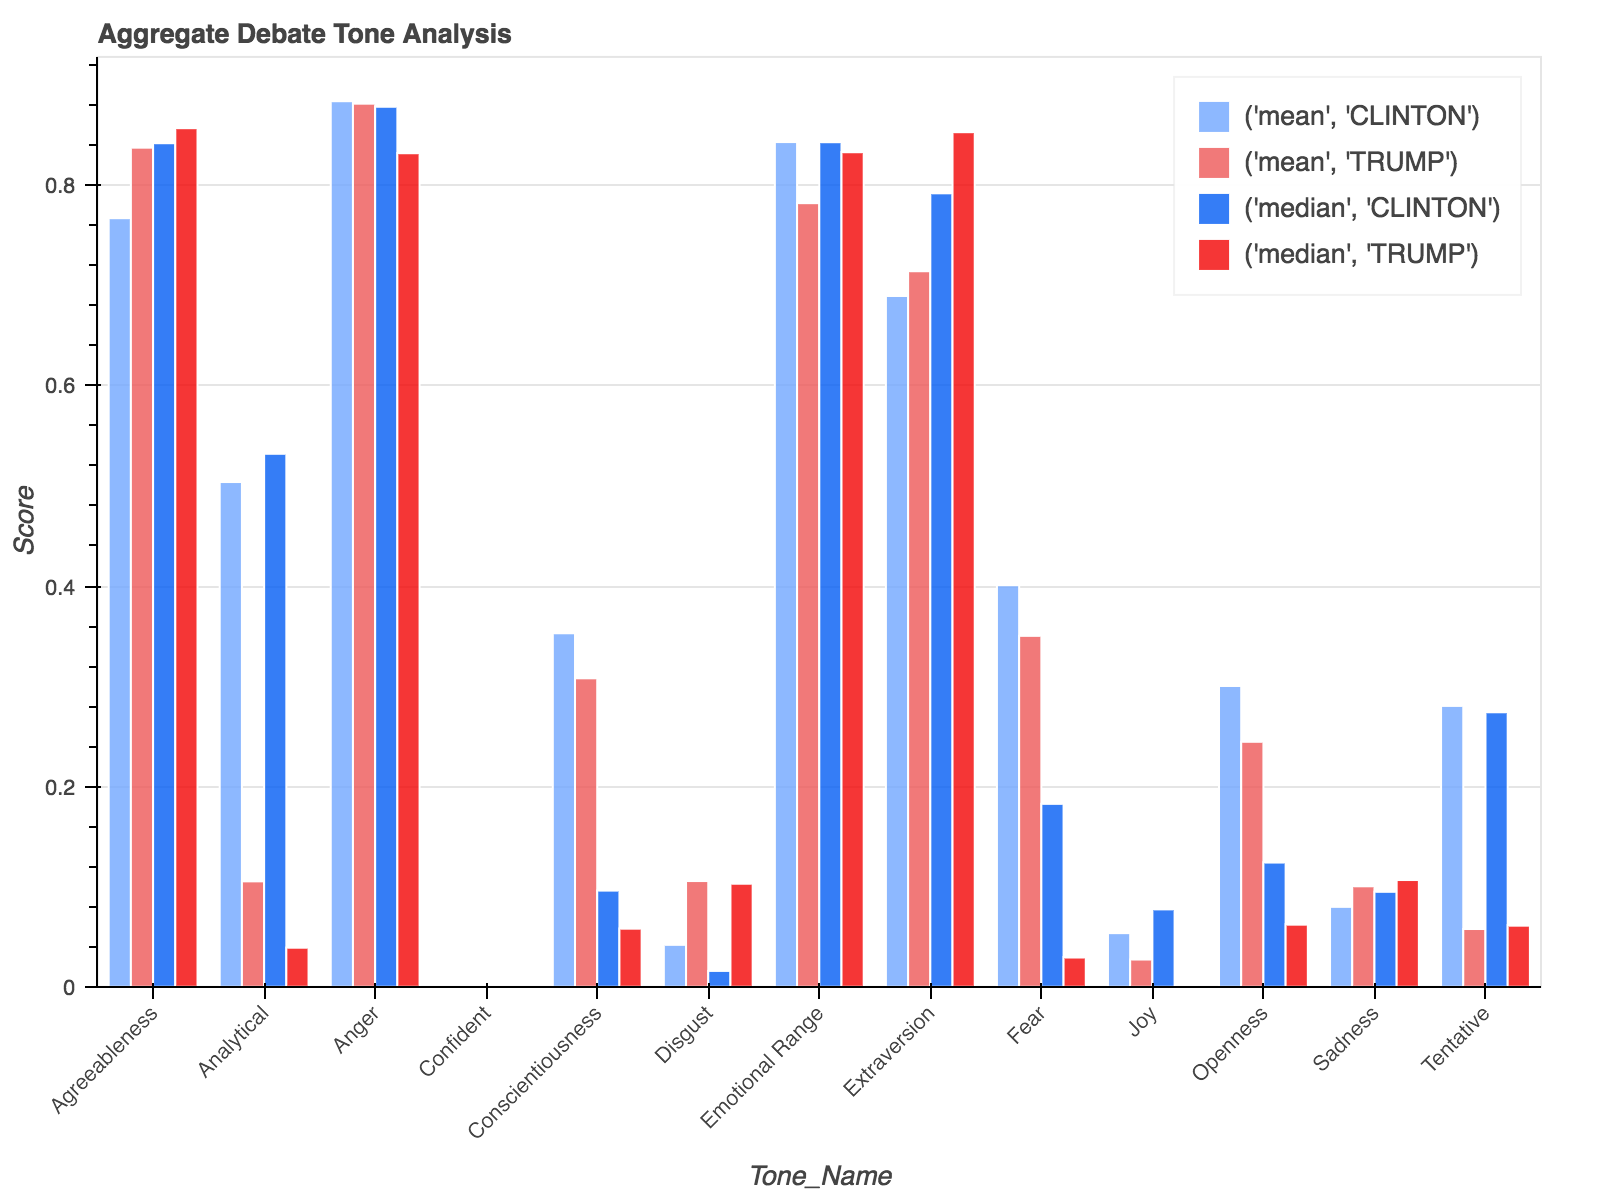
Takeaways:
- Overall both candidates’ tone’s were fairly negative in all the debates.
- The Joy tone never reached above ~ 0.08 / 1.00 for either candidate.
- Both Clinton and Trump were not Confident throughout the debates?
- Clinton was more Analytical, Fearful and Tentative than Trump.
- Trump was more Extraverted and full of Disgust.
- The tone with the largest difference between the two candidates was Analytical.
- Clinton’s mean Analytical score was 0.503813.
- Trump’s mean Analytical score was 0.105237.
View on github.